Navigation
|
Tutorial
|
What is this
GlycoMiner Tutorial by Example
1. Introduction
GlycoMiner was developed to help with identification of N-glycans from glycopeptide LC-MS/MS measurement. It is based on an empirical algorithm, that trys to mimic the way humans try to interpret these spectra.
What you need to use glycominer:
- MS/MS spectra (supported formats: Waters ProteinLynx project, ASCII files from Thermo instruments, Kratos ASCII file format, Peak list (pkl) format)
- Protein sequence data: it is helping to have knowledge about possible protein sequences, but it is not mandatory
- The ionic species should be H+ adducts, although it will be possible to set others in the future
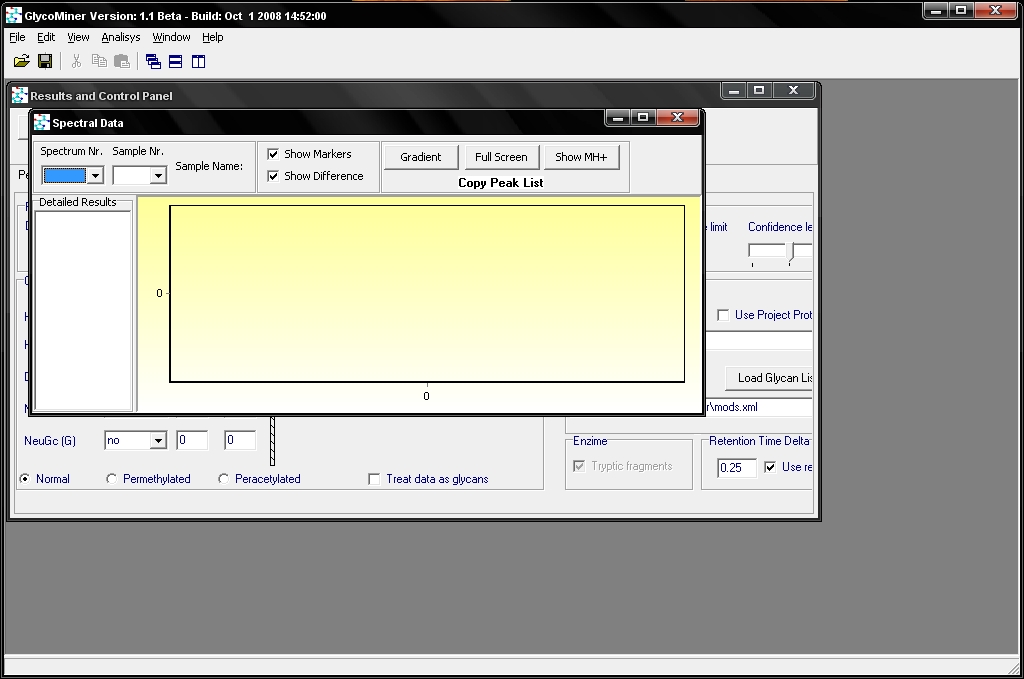
First, you have to start the program (by double clicking on its icon) and accept the license agreement. After that you get to the main window of GlycoMiner:
2. Loading an experiment file
First
you have to open an existing experimental data file (the supported
formats are listed here) by pressing the open icon (or File/Open Menu).
An example measurement can be found in the install directory (by
default c:\Program Files\GlycoMiner\ExampleProject\) or alternatively
you can download from here.
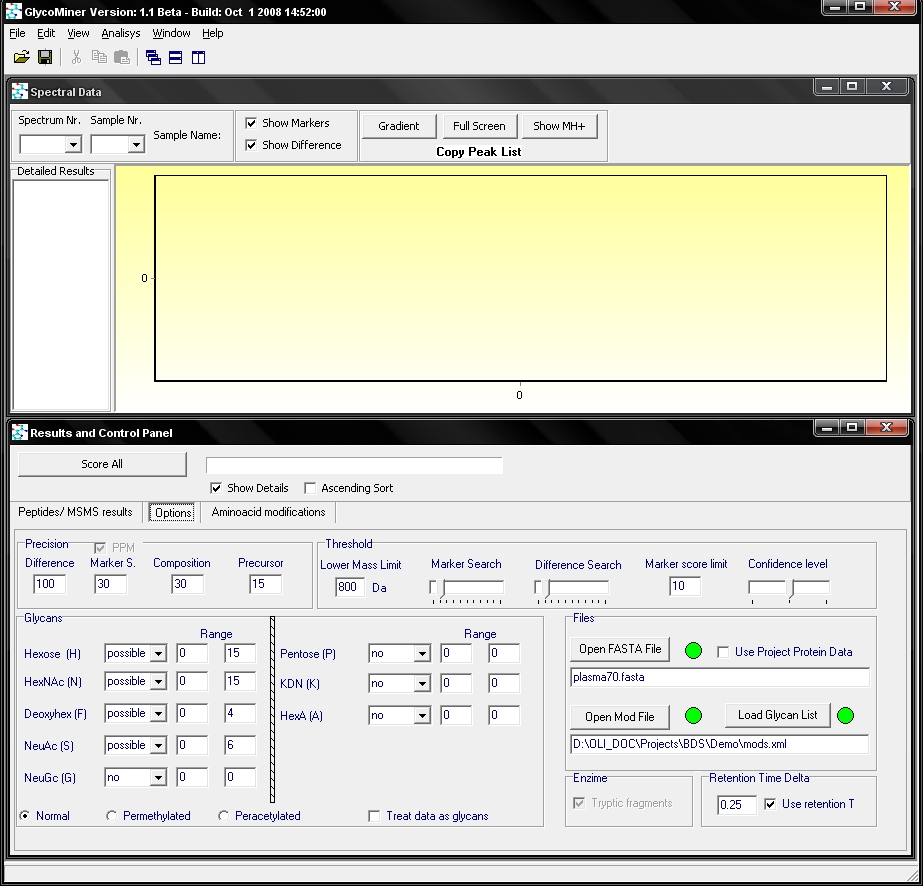
After opening the file the software starts to process data which takes a few seconds (depending on the speed of your computer). You can see the following window:
After opening the file the software starts to process data which takes a few seconds (depending on the speed of your computer). You can see the following window:
The
window on the bottom 'Results and Control Panel' shows the result of
search. For each MS/MS spectrum of a sample the precursor ion data
(charge, mass and intensity, retention time), score values and
results of analysis are listed as a table. GlycoMiner will
display the name or composition of the found glycan parts either as a
conservative structure or as a monosaccharide composition, the sequence
or mass of the peptide ion and the mass accuracy in ppm, relativ to the
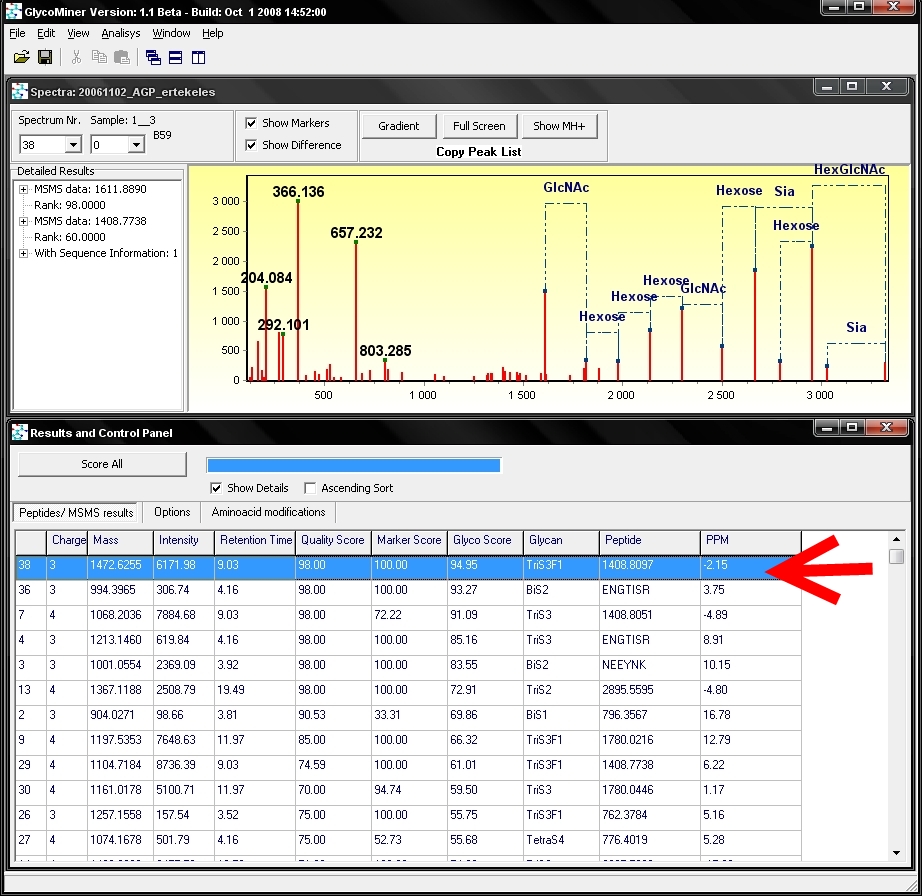
precursor ion mass. The spectrum window above shows the
MS/MS spectra of the highlited row (red arrow). If you want to see a
different MS/MS spectra you have to double click on the respective row.
E.g. if you wish to see the 4th MS/MS spectra, you have to
double-click on the 4th row on the table:
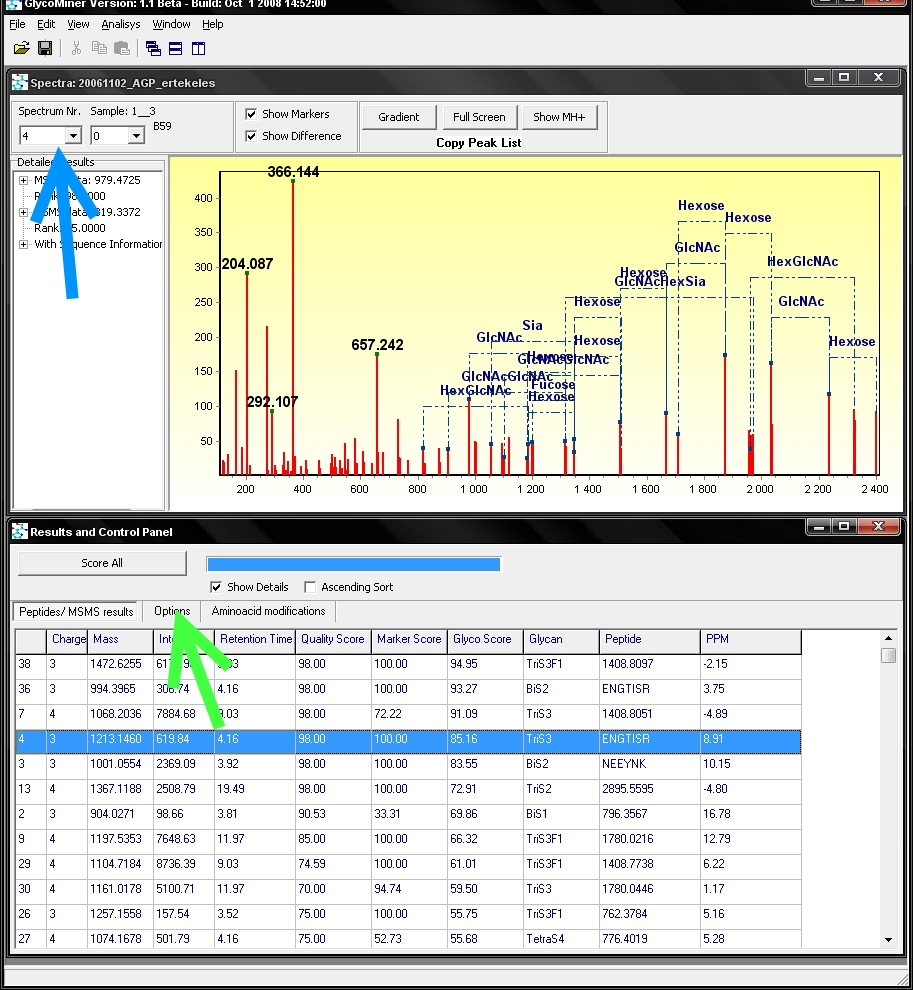
Note
that the spectrum number is indicated top left corner of spectrum
window (blue arrow), where another spectra can be selected as well.
By clicking on the options tab (green arrow), a setting window can be seen
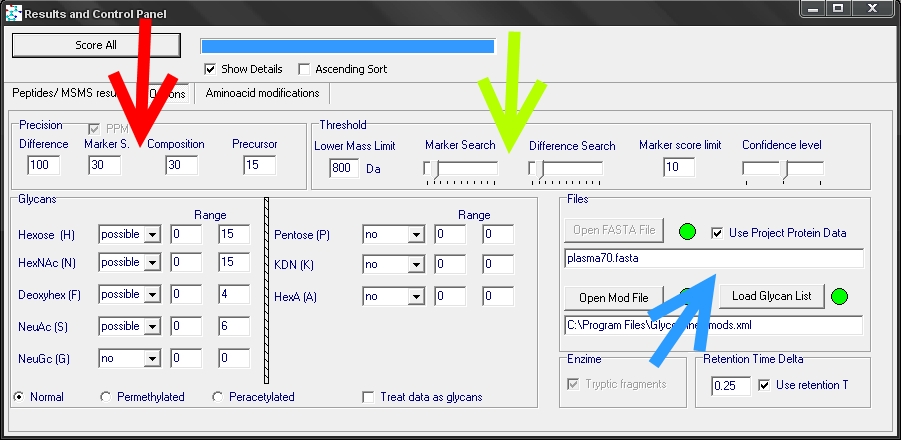
It is possible to set the accuracy parameters for the spectrum search and for composition calculation (red arrow). Also the type and amount of sugar units is settable. A setting named “lower mass limit” can be specified. This sets the lower and upper mass regions for peak search. It should be set near the mass of the smallest peptide backbone that is glycosylated. There are options to specify the protein data (blue arrow), peptide modifications(mod file) and the frequent glycan compositions (glycan list). Intensity thresholds can be given separately for lower and upper m/z region (green arrow).
Most important settings ( typical user only cange these) are the mass accuracy settings and the intensity threshold for glycan peaks. The software has preset values, useful when working on a Q-Tof, but in practice other values may be more suitable to use. The accuracy parameters should be set according to the current mass spectrometers performace, as should be the intensity threshold values.
If you can, you should provide a protein database in FASTA format. The size of the database is advised to be kept small, as the false peptide sequence hits is proportional to the size of this file. In practice it should contain no more than 100 protein sequences, but up to 100 000 sequences are possible. If the protein has a signal peptide, it is good to provide the sequence that is missing that peptide, as automatic search uses only tryptic peptides.
The mod file is a text file containing frequent modifications found on peptides, like carbamidomethylation on cystein. If the provided aminoacid modifications are not satisfactory, you can make youre own file and load it in the software. Currently the software takes it as a fixed modification. Also there is a glycan list that is used for naming the results of the computation. This can also be changed by loading a new one
The spectrum window, along with showing the spectra and the markup, also has a details panel, where the results are detailed. Here the list of candidate peaks and the corresponding compositions are shown. The spectrum window also gives the possibility to jump between spectra and samples.
To be continued ....
By clicking on the options tab (green arrow), a setting window can be seen
It is possible to set the accuracy parameters for the spectrum search and for composition calculation (red arrow). Also the type and amount of sugar units is settable. A setting named “lower mass limit” can be specified. This sets the lower and upper mass regions for peak search. It should be set near the mass of the smallest peptide backbone that is glycosylated. There are options to specify the protein data (blue arrow), peptide modifications(mod file) and the frequent glycan compositions (glycan list). Intensity thresholds can be given separately for lower and upper m/z region (green arrow).
Most important settings ( typical user only cange these) are the mass accuracy settings and the intensity threshold for glycan peaks. The software has preset values, useful when working on a Q-Tof, but in practice other values may be more suitable to use. The accuracy parameters should be set according to the current mass spectrometers performace, as should be the intensity threshold values.
If you can, you should provide a protein database in FASTA format. The size of the database is advised to be kept small, as the false peptide sequence hits is proportional to the size of this file. In practice it should contain no more than 100 protein sequences, but up to 100 000 sequences are possible. If the protein has a signal peptide, it is good to provide the sequence that is missing that peptide, as automatic search uses only tryptic peptides.
The mod file is a text file containing frequent modifications found on peptides, like carbamidomethylation on cystein. If the provided aminoacid modifications are not satisfactory, you can make youre own file and load it in the software. Currently the software takes it as a fixed modification. Also there is a glycan list that is used for naming the results of the computation. This can also be changed by loading a new one
The spectrum window, along with showing the spectra and the markup, also has a details panel, where the results are detailed. Here the list of candidate peaks and the corresponding compositions are shown. The spectrum window also gives the possibility to jump between spectra and samples.
To be continued ....
3. Examples
Under construction!
Example video is available here. To be able to play it you need XVID codec installed, which is freely available.5. Known bugs
- Before loading a new file you have to use UNLOAD (File/Unload Menu).
- Retention time
- If you experience any problem please restart the software. If it does not solve the problem please contact us, and we will correct it ASAP.
